View and track your students' performance on assignments, practice, and tests in the Course Gradebook.
Access the Student Performance Tab
-
Click Gradebook.
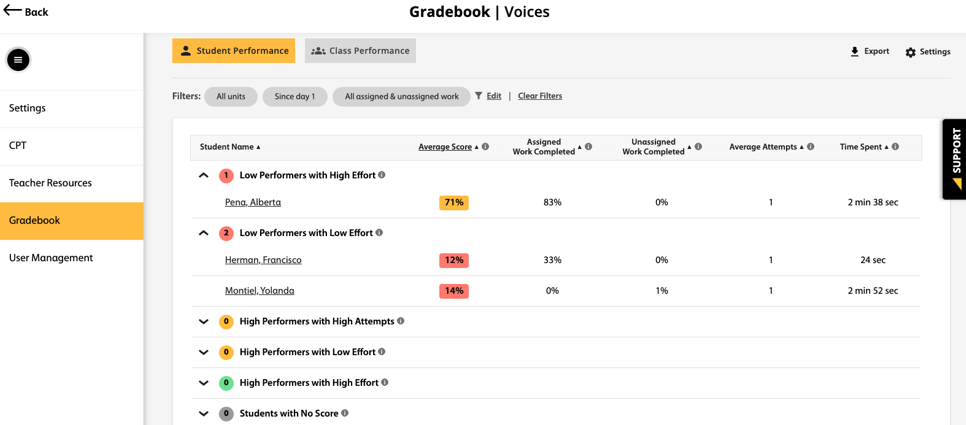
The Student Performance tab display. You can see each student's:
- Average score
- Percentage of all assigned work completed
- Percentage of all unassigned work completed
- Average number of attempts
- Total time spent on all the work
Note If your course is set up to show only assigned work, filters, and scores for unassigned work will not display in your Gradebook.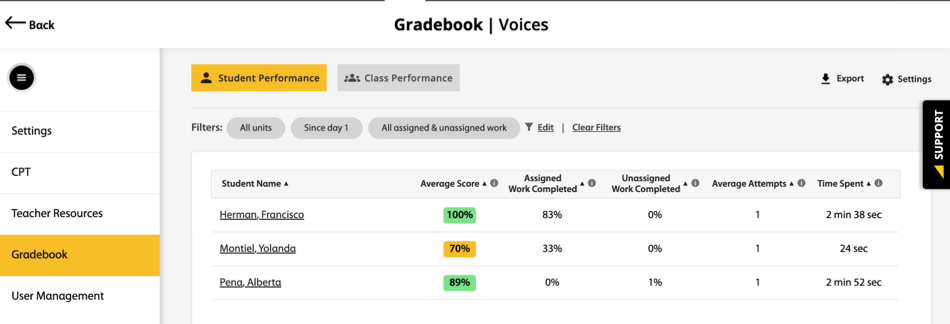
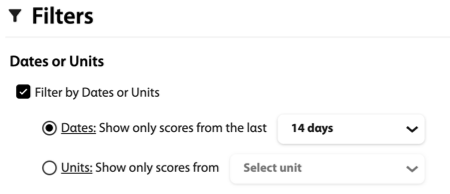
Filter Gradebook
| To filter by | Do this |
|---|---|
| Dates or Units |
|
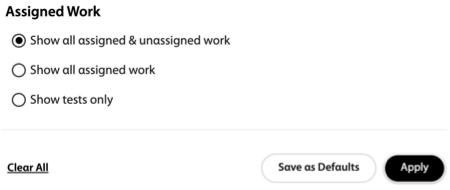
| Assigned Work |
|
Cohorts View
Group students into cohorts based on performance, effort, and attempts.
The cohorts view allows you to easily identify which students are high-achieving and which students are struggling.
-
Click
 .
.
-
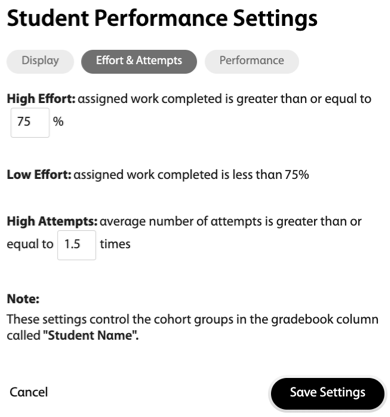
Click Display.
- Optional:
Click Effort & Attempts to set the High
Effort and High Attempt settings for your class.
Low Effort score is automatically set to less than the High Effort score.
- Optional:
Click Effort & Attempts to set the High
Effort and High Attempt settings for your class.
-
Click Save Settings.
The students are grouped into cohorts based on their performance, effort and attempts.
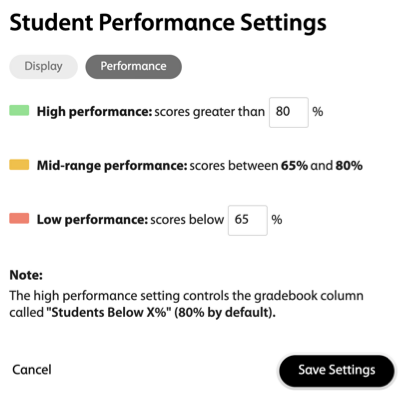
Student Performance Settings
The student performance settings allow you to determine the score ranges for high, middle, and low performing students.
-
Click .
-
Set the High Performance or Low Performance ranges for your class.
The Mid-range Peformance score automatically updates.
View an Individual Student's Performance
-
Click the student's name.
You can see the student's:
- Overall average course score
- Weekly trend for average course score
- Percentage score on each completed unit
- Points scored on each completed unit
- Percentage of the work completed for each unit
- Average number of attempts on each activity, assignment, and test within a unit
- Total time spent on each unit
- Optional:
To filter by dates, units, average score, or type of work, click
 .
.
- Select your desired filters.
- Click Apply.
- Optional:
Click
 next to a specific unit to display the student's
performance on individual activities, assignments and tests within that
unit.
next to a specific unit to display the student's
performance on individual activities, assignments and tests within that
unit.
- Optional:
Click the activity or assignment name to display the student's performance
on that assignment.
-
Click
 to see the student's answers on that
assignment.
to see the student's answers on that
assignment.
-
Click
Create a Gradebook Report
 on any page within the Gradebook.
The report will only contain data displayed on that page, including all the applied filters.
- Select either CSV or XLSX file for your report.